
Core Web Vitals Explained: LCP, INP, and CLS
Core Web Vitals are three numbers Google uses to describe how a page feels to a real visitor: Largest Contentful Paint (how quickly the main content appears), Interaction to Next Paint (how quickly the page reacts when someone taps or clicks), and Cumulative Layout Shift (how much the layout jumps around while loading). A page passes when it hits the "good" threshold on all three for at least 75 percent of real visits. This guide explains each metric in plain language, shows a real measurement of a live page, and walks through the fixes that actually move each number.
Part 6 of 12 in the HighSEOTools SEO learning path.
Why Google measures feel, not just speed
For years, advice about making a website "fast" was frustratingly vague. Core Web Vitals changed that by turning page experience into numbers you can measure, track, and improve. They belong to a broader family of signals Google calls page experience: the idea that a page can hold great content and still frustrate people if it loads slowly, shifts around as it renders, or feels sluggish when tapped.
Be realistic about their weight, though. Core Web Vitals are a ranking signal, not the ranking signal — relevance and content quality still dominate. When two pages are closely matched, experience can act as a tiebreaker, and a very poor score can hold an otherwise strong page back. Just as usefully, these metrics tend to track real outcomes like bounce rate and conversions, so improving them can pay off even if you ignore search entirely.
The three metrics in plain language
Largest Contentful Paint (LCP)
LCP measures loading. It marks the moment the largest visible element in the viewport — the part of the page you can see without scrolling — finishes rendering (being drawn on screen). That element is usually a hero image, a video poster, or a large block of headline text. LCP answers the question every visitor asks without thinking: has the main content actually shown up yet?
Thresholds: good is 2.5 seconds or less, needs improvement runs up to 4 seconds, and anything slower is poor.
Interaction to Next Paint (INP)
INP measures responsiveness, and it is the metric most people are still catching up on. In 2024 it replaced First Input Delay (FID) as a Core Web Vital. FID only timed the delay before the browser began processing your very first interaction. INP is far more demanding: it watches every tap, click, and key press across a visit and reports a value near the worst one, covering the full delay from your interaction to the next frame the browser paints. It reflects how snappy the page feels the whole time you use it, not just on first contact.
Thresholds: good is 200 milliseconds or less, needs improvement runs up to 500 milliseconds, and above that is poor.
Cumulative Layout Shift (CLS)
CLS measures visual stability: how much the page unexpectedly shifts around as it loads. If you have ever gone to tap a button only for an ad or image to drop in and push it away at the last second, you have felt bad CLS. Unlike the other two metrics it is a unitless score, not a time.
Thresholds: good is 0.1 or less, needs improvement runs up to 0.25, and higher is poor.
All three are judged at the 75th percentile of page loads — line up all recorded visits from best to worst, and the value three-quarters of the way in is your score. That means most of your visitors, not just the lucky ones on fast connections, have to get the good experience. Aim for the good band on all three; passing two while failing the third still means real people are hitting a real problem.
Lab data versus field data
When you measure these metrics you will meet two flavors of data, and confusing them leads to bad decisions.
Lab data comes from a synthetic test: a single simulated page load on a fixed device and connection, produced by a tool such as Google's Lighthouse. It is repeatable and ideal for debugging because conditions stay constant — but one simulated visit may not reflect your actual audience on older phones and patchy networks, and lab scores naturally vary a little between runs.
Field data comes from real visitors. Chrome collects it for sites with enough traffic and publishes it in the Chrome User Experience Report (CrUX) as a rolling 28-day window. Field data is what feeds the Core Web Vitals assessment that can influence rankings, so it is the source of truth. One important consequence: INP only exists in field data, because it needs real interactions — a lab run loads the page but nobody taps anything, so lab tools can only offer proxies for responsiveness.
A real measurement, read line by line
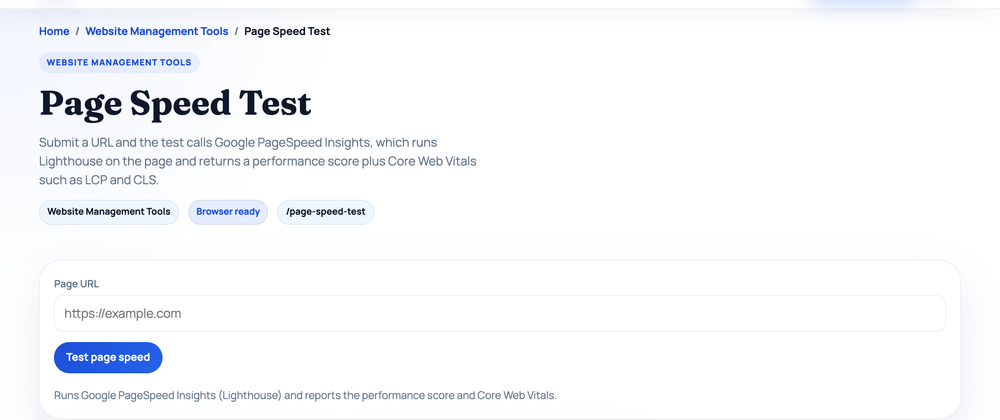
Here is what this looks like in practice. We ran the free Page Speed Test — which queries Google's PageSpeed Insights, combining a Lighthouse lab run with CrUX field data — against the Wikipedia article on web performance, on the mobile strategy (checked 2026-07-17):
- Performance score: 98/100 (a lab score from Lighthouse).
- Field data (real Chrome users, trailing 28 days): LCP 912 ms, INP 92 ms, CLS 0.00, First Contentful Paint 882 ms, Time to First Byte 527 ms — every vital rated good.
- Lab data (one simulated mobile load): LCP 1.2 s, Total Blocking Time 20 ms, CLS 0.
Two teaching points hide in those numbers. First, field LCP (912 ms) and lab LCP (1.2 s) disagree — that is normal. The lab run throttles the connection to simulate a mid-range phone, while the field number aggregates every real visit, many on fast connections. When lab and field disagree, trust field for "how are we doing?" and use lab for "what exactly is slow?". Second, notice the field list includes a true INP (92 ms) but the lab list shows Total Blocking Time instead — the total time the browser's main thread was too busy to respond during load. That is the lab proxy for responsiveness; when a page is too small to appear in CrUX, no true INP exists to show, and the tool falls back to it.
Your own site's field data lives in the Core Web Vitals report in Google Search Console, which we cover in the Search Console guide. Low-traffic sites often have no CrUX data at all — that is not a penalty, it simply means you rely on lab testing until traffic grows.
How to fix each metric
To improve LCP, get the largest element on screen sooner. Compress and correctly size your hero image, serve modern formats like WebP or AVIF, and add a preload hint — <link rel="preload" as="image" href="hero.webp"> — so the browser fetches it early. Reduce server response time, use a content delivery network (a CDN, which serves files from locations near each visitor), and remove render-blocking scripts and stylesheets — resources the browser must download before it can draw anything. Lazy-load images below the fold, but never lazy-load the LCP element itself: that delays the exact thing the metric times.
To improve INP, the enemy is JavaScript hogging the main thread — the single lane where the browser runs scripts, handles input, and paints frames; while a long task runs, taps go unanswered. Break long tasks into chunks so the browser can respond in between, defer or remove scripts not needed at load, and trim heavy third-party tags such as chat widgets and trackers. A leaner page almost always feels more responsive.
To improve CLS, stop surprising the layout. Set explicit width and height attributes (or CSS aspect ratios) on images, videos, and embeds so the browser reserves the space before they arrive. Reserve fixed slots for ads and injected content, never insert elements above what someone is already reading, and preload fonts to limit the reflow a late font swap can cause.
Page weight feeds all three, and it helps to know what "lean" even looks like. The Website Page Size Checker fetches a URL and weighs its HTML document. Run on example.com (checked 2026-07-17) it reports 559 bytes of HTML — 0.5 KB — with zero scripts, stylesheets, or images, which is why that page appears essentially instantly anywhere in the world. Real pages carry far more, and note the tool's own caveat: it measures the HTML document only, while total page weight also includes the images, CSS, JavaScript, and fonts the browser loads afterwards. If your HTML alone is into the hundreds of kilobytes, that is an early warning worth chasing.
A repeatable workflow
- Measure first. Run your most important pages through the Page Speed Test on mobile — mobile is usually the harsher and more representative test.
- Fix the biggest gap. Whichever vital sits furthest from its good threshold is the priority. The tool lists Lighthouse "opportunities" with estimated savings to point you at specific culprits.
- Change one thing, then re-test. If you fix three things at once, you will not know which one worked — or which one made something else worse.
- Confirm in field data. After deploying, watch Search Console's Core Web Vitals report. Because CrUX is a 28-day rolling window, real-user numbers shift gradually; give a change a few weeks before judging it.
- Stop when you are green. Once all three vitals sit in the good band at the 75th percentile, further micro-optimization rarely repays the effort. Spend that time on content.
Speed is a habit, not a sprint
Core Web Vitals give you a concrete definition of a fast, stable, responsive page: LCP 2.5 s or less, INP 200 ms or less, CLS 0.1 or less, for three out of four visits. Treat lab tools as your debugging workbench and field data as your scoreboard, fix the largest gap first, and re-measure after every change. The payoff is a site that is genuinely easier to use — which serves your visitors first and your search visibility with them.
Next in the learning path: with your pages fast and stable, the next step is helping search engines understand what they contain. Part 7 covers schema markup — the structured-data vocabulary that can turn plain listings into richer search results.
Sources and official references
Use these external references to verify the guidance and terminology in this article.
Frequently asked questions
What replaced First Input Delay as a Core Web Vital?
Interaction to Next Paint (INP) replaced First Input Delay (FID) in 2024. While FID only measured the delay before the browser processed the first interaction, INP evaluates responsiveness across all interactions during a visit, making it a much fuller measure of how snappy a page feels.
What are the good thresholds for Core Web Vitals?
A page is rated good when LCP is 2.5 seconds or less, INP is 200 milliseconds or less, and CLS is 0.1 or less, all measured at the 75th percentile of page loads. Aim to hit the good band on all three rather than just one or two.
What is the difference between lab data and field data?
Lab data comes from a synthetic test in a controlled environment and is ideal for debugging because conditions stay constant. Field data comes from real visitors and reflects how your site actually performs. Field data is what feeds the Core Web Vitals assessment, so use lab tools to diagnose and field data to confirm.